Top 5 Monitoring Tools Every System Administrators Should Know

System Monitoring Software: System Monitoring Software: System administrators are tasked with monitoring software network / server that runs the backbone of any business today. They have to be alert with the activities on the system and should detect slow or defective components. The monitoring tools that we will be featuring here can automatically send updates or activate backup copies in case of interruptions caused by server crashes or overloads, network connections, and other factors. In the case of requesting the status of the faults, the monitoring software can send an alarm message to the system administrator, in turn in failover systems to eliminate the problem of the server until it can be corrected, or make other imperative actions.
For those of people who are looking for monitoring tools that can handle small and large infrastructures, here is a list of some of the best open source applications and network monitoring software that you can use for free:
Zenoss Core
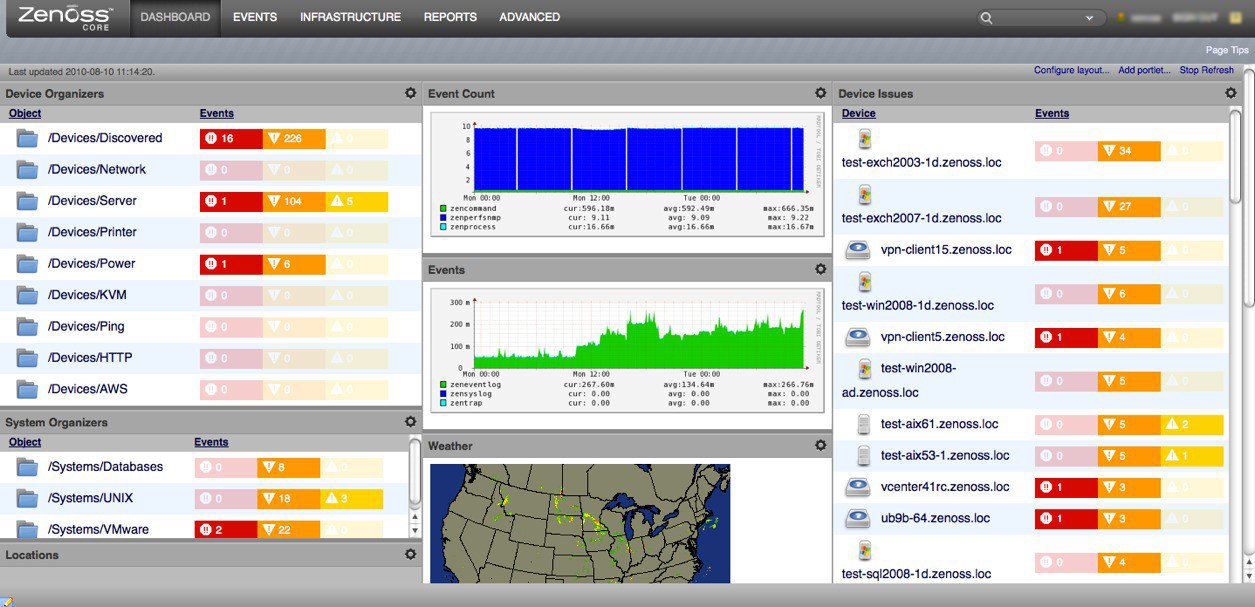
Based on the Zope application server and written in Python, Zenoss Core is a server and network management platform that combines original programming and several open source projects to integrate data storage and data collection processes. data through the Web-based user interface. It allows users to monitor availability, inventory and configuration, performance and events. Zenoss Core is able to monitor the availability of network devices through SNMP, SSH, WMI, network services like HTTP, POP3, NNTP, SNMP, FTP and host resources (processor, disk usage) in most systems network operations. A plug-in architecture provided by ZenPacks allows members of the community to extend its functionality. ZenPacks are encapsulated in Python and instrumentation supplies and reports for units of the tracking infrastructure.
Cacti
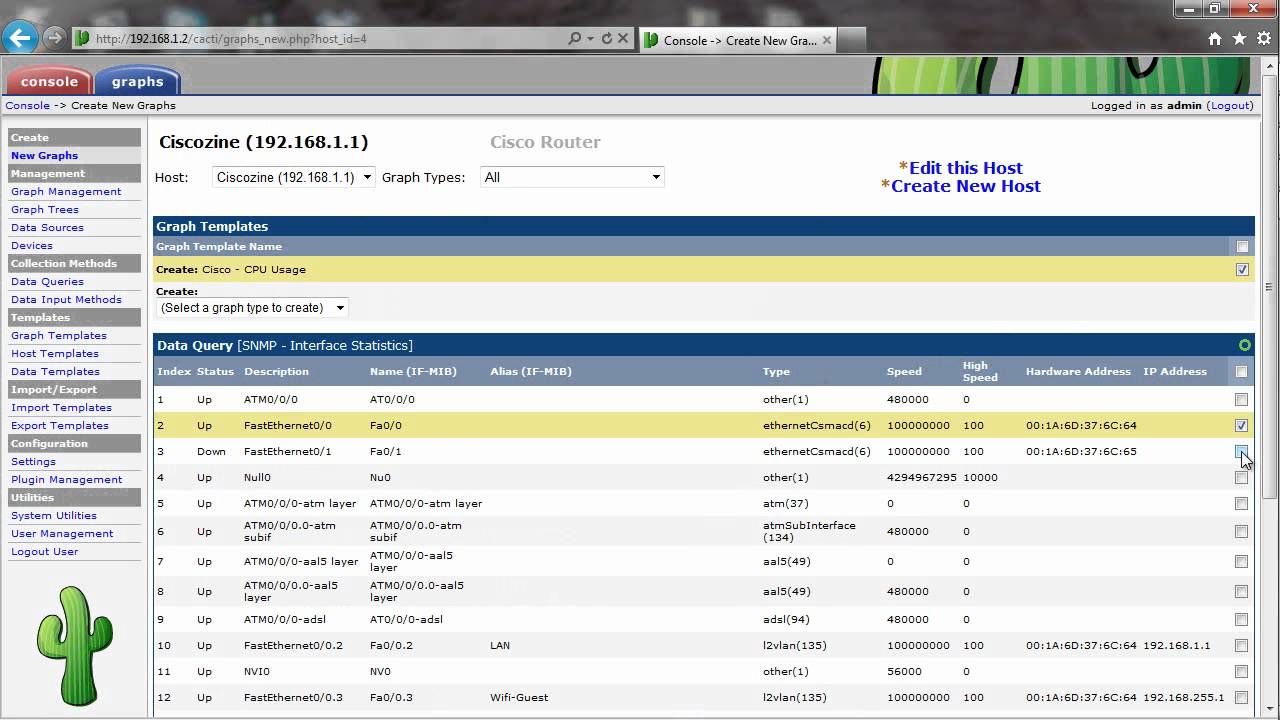
Cacti is a graphical web tool that is designed as a complete interface for RRDtool data storage and graphical utility that allows users to monitor and graph the CPU load, network bandwidth utilization, traffic network, and much more. It can be used to configure the data collection itself, which allows particular configurations, to be controlled without any manual configuration of RRDtool. Cacti allow polling the services in the pre-established period and the graph of the resulting data. It is mainly used to graphically represent the time series data of parameters such as the CPU load and the network bandwidth utilization. Cacti can be extended to control any source through shell scripts and executables. It also supports plug-in architecture and has a large and active community that has gathered around the Cacti forums to provide scripts, templates, and tips on creating plugins.
Nagios
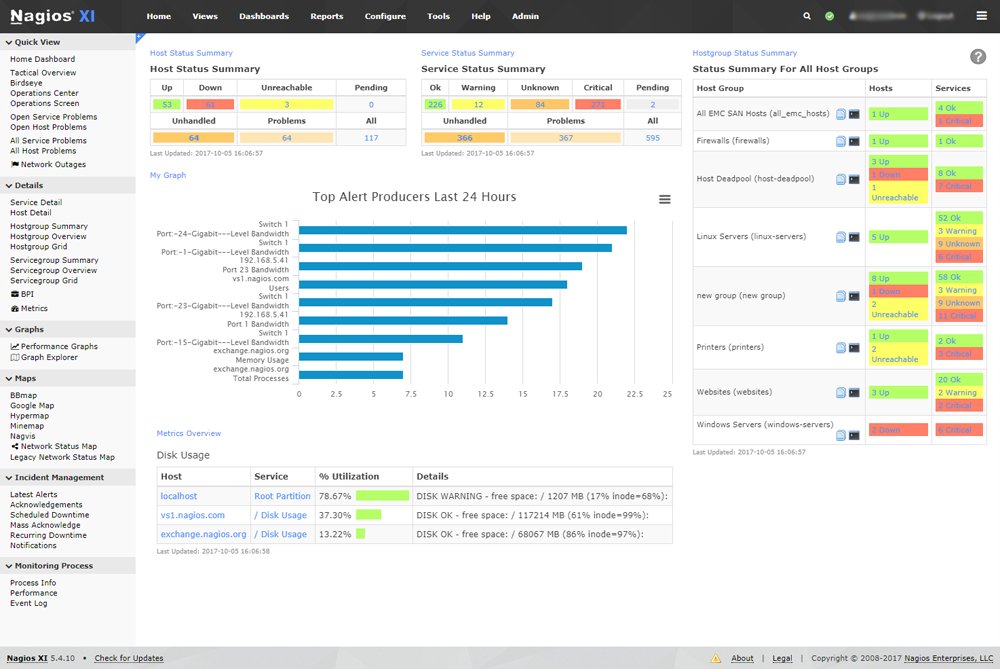
Nagios is considered one of the most popular, if not the most popular open source network monitoring system available. It was originally designed to run on Linux, but other Unix variants are also supported. Nagios provides monitoring of network services like SMTP, POP3, HTTP, NNTP, ICMP, SNMP, FTP, SSH and host resources like processor load, disk usage, system logs, among others. The remote control is managed through SSH tunnels or encrypted SSL. Nagios has a simple design that offers users the freedom to develop their service checks without own effort based on the needs and by using any of the support tools that you like. To detect and differentiate between hosts that are below and those that are unreachable, Nagios allows you to define the hierarchy of the host network with the “parent” hosts. When services or reception problems arise, the notification will be sent to the person in charge of the network through email, SMS, etc.
Munin
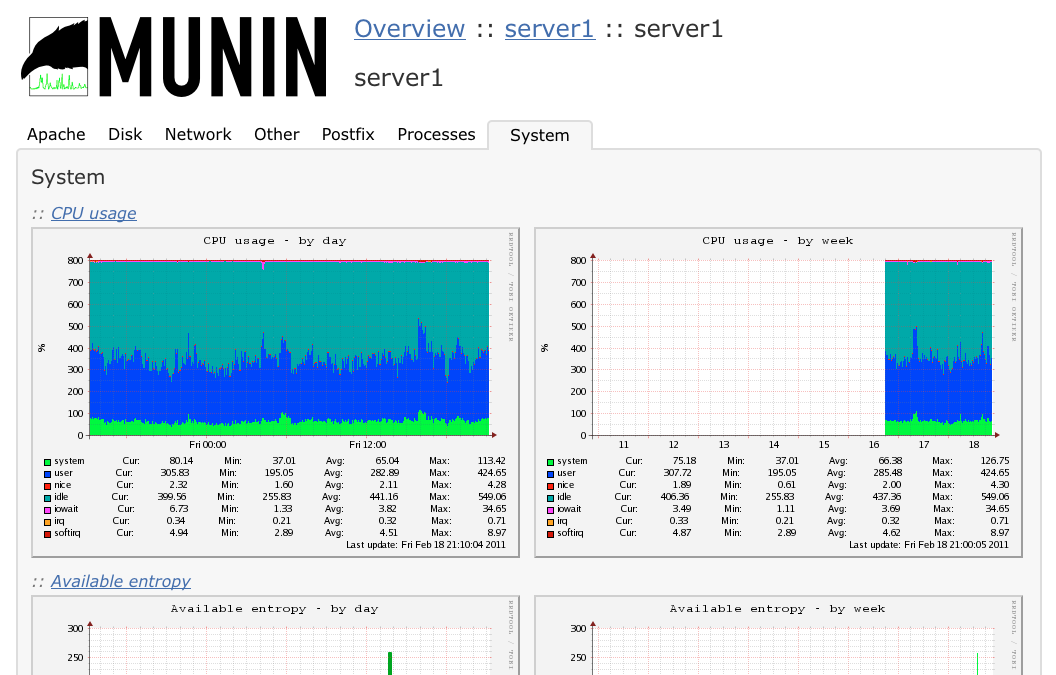
Like the Cacti, Munin uses RRDtool to present graphical results through a web interface. It has a master/node architecture in which the master binds all the nodes at regular intervals and requests the data. Using Munin, you can quickly and easily monitor the performance of your computers, networks, SAN networks, and applications. This makes it easy to detect the problem when a performance problem occurs and see clearly how it is doing the rational capacity of all restricted resources. For the Munin plugin, its main priority is the plug and play architecture. It has a lot of control plugins available that will easily work without a lot of modifications.
Zabbix
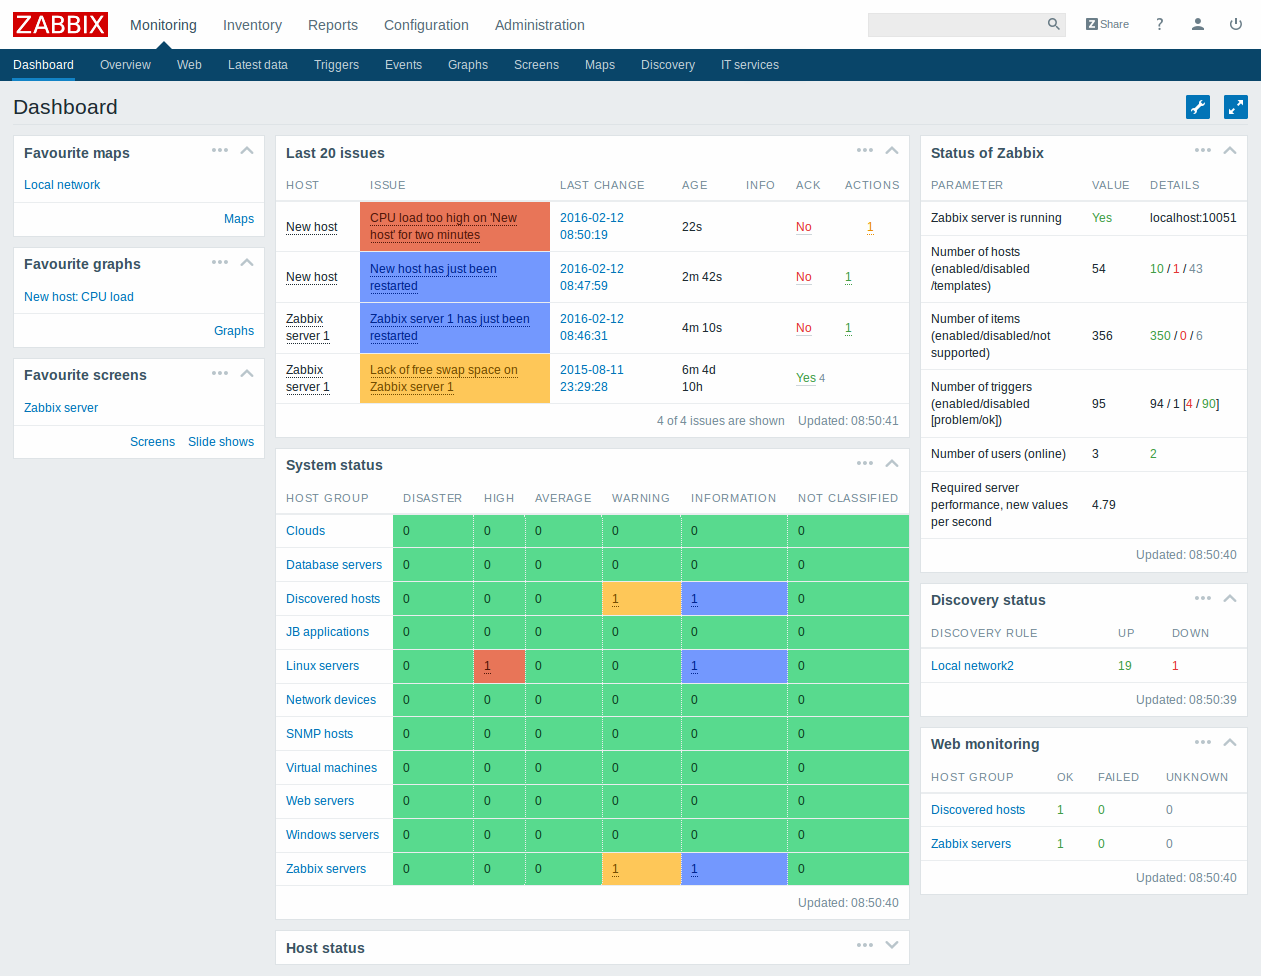
Zabbix is a kind of business-type surveillance mechanism that is fully equipped and has commercial support. It is able to monitor and track the status of different types of network services, servers and other network hardware. Zabbix has great visualization features including user-defined views, zoom, and cartography. It has a versatile communication method that allows a quick and easy configuration of the different types of notifications of predefined events. Zabbix has three main modules: the server, the agents, and the user. To store the tracking data, you can use MySQL, PostgreSQL, Oracle or SQLite as the database. With no need to install any software on the tracking host, Zabbix allows users to check the availability and responsiveness of standard services, such as SMTP or HTTP. To monitor statistics, such as CPU load, network utilization, and disk space, a Zabbix agent must be installed on the host machine. Zabbix includes support for monitoring through SNMP, TCP and ICMP controls, IPMI and custom parameters as an option to install an agent on hosts.
0 Comments